I selected this dataset for analysis because I was curious to understand, through visualization and simple statistics, how users interact with products on such a large marketplace. Even though I have never personally used Amazon, I wanted to analyze how price, description, rating, and the number of reviews influence purchasing decisions. This allowed me to examine online shopping not from the perspective of the buyer, but from the platform’s own perspective and its statistical data.

As part of the project, several types of charts were constructed: a tree diagram, a bar chart, a histogram, and a scatter plot.
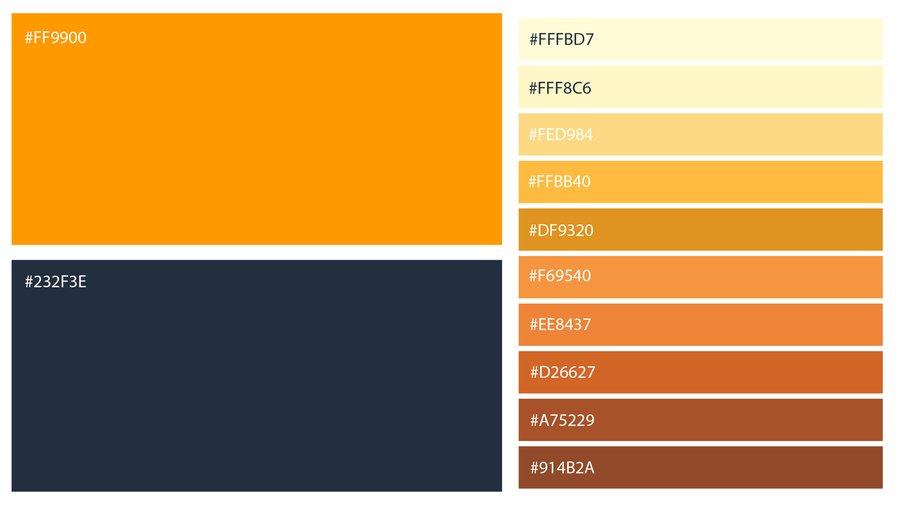
Amazon’s signature colors—dark blue and orange—were used to style the visualizations to maintain stylistic consistency and ensure the charts were recognizable. Shades of orange were also incorporated to provide a more diverse and readable visualization.
I sourced the dataset from Kaggle.
Recraft was used to generate the image for the cover.
[1] Most Popular Product Categories
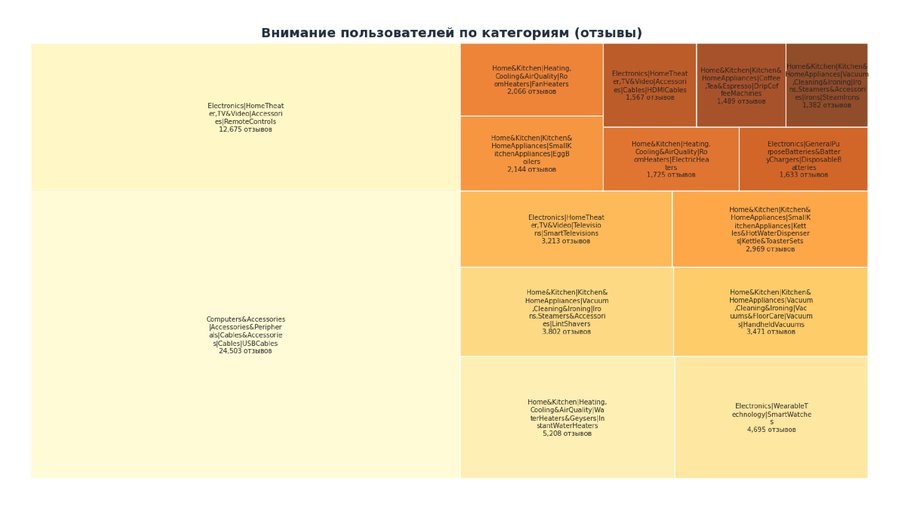
To begin, I decided to study which product categories and subcategories on the Amazon market are most popular among buyers. To do this, a tree diagram was constructed based on the categories and the number of reviews associated with each one.
Top 15 Most Popular Products Based on Number of Reviews
Each tile represents a product category. The size of the tile represents the total number of reviews in that category.
It became clear that the Computers&Accessories|USB Cables category is the absolute leader with 24,503 reviews. Following it by a significant margin are RemoteControls, while InstantWaterHaters and SmartWatches received fewer reviews, and the lowest in the sample belongs to StreamIrons in the Home&Kitchen category.
Buyers show the greatest interest in household appliances and electronics.
We can conclude that the segment of inexpensive accessories and electronics is the most engaged.
[2] Top 10 Categories by Product Count
The next step I decided to take was to analyze the number of products in each category to understand which ones are the most popular for placement and sale.
Top 10 Categories by Product Count
The chart displays a pronounced uneven distribution, with the Computers & Accessories | USB Cables category containing a disproportionately large number of items. This may suggest mass production of similar goods or a multitude of cable variations.
Electronics and accessories are the key product groups by volume, and thus likely by demand.
The tail of the distribution represents categories where fewer items are present. Perhaps the demand for these items is significantly lower, which is why the market is not saturated with them.
[3] Product Rating Dependence on Description Length
I was also interested in seeing whether the length of the product description in any way affects its popularity with buyers. Do they trust longer or shorter product descriptions more?
Product Rating Dependency on Description Length
Looking at the chart, most products have descriptions ranging from 200 to 800 characters. Ratings are between 3.5 and 4.5, with a cluster around 4.1–4.3. However, the metrics do not show a clear correlation, which suggests that user rating is not dependent on the length of the product description. Perhaps the actual quality of the item, the brand, or the reviews have a much stronger influence.
[4] Average Product Rating
Next, I decided to track the average rating of all products on the market. For this, a histogram was created.
Product Rating Distribution
It is clear that the distinct peak is reached in the range of approximately 4.1–4.3. Scores below 3.5 are rare, and scores below 3 are almost non-existent. The distribution is heavily skewed to the right, meaning toward higher ratings.
This might be due to users tending to give high scores, or possibly because negative reviews are being filtered out.
Conclusion:
The analysis revealed that user behavior on the Amazon marketplace reflects consistent patterns: most products have high ratings (ranging from 4.0 to 4.5), and the number of reviews across categories is extremely unevenly distributed. The consumer electronics and accessories segments stand out particularly, as they contain the largest concentration of products and reviews.
The significant skew in item counts within certain categories (such as USB cables) may indicate market saturation or assortment duplication.
The scatter plot demonstrated that the length of the product description has almost no impact on its rating. This suggests that it is likely not the volume of the text, but rather the quality, structure, and relevance of the description that is important to users.