Исходный размер 1536x864
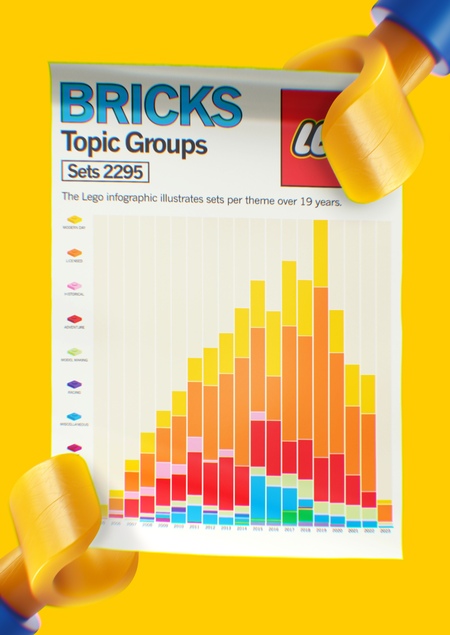
Концепция плакатов направлена на визуализацию количества наборов LEGO в различных тематических группах по годам, показывая динамику развития с течением времени.
Исходный размер 3073x1727
В рамках проекта была использована программа Nodebox для анализа данных и создания визуализаций. С помощью этой программы я работала над созданием графиков различных типов, включая чарты, тримап и даже джанк-чарты.
Исходный размер 1920x1080
Исходный размер 3538x1656
Исходный размер 3000x1797
Исходный размер 2500x1405
Исходный размер 2500x1405
Исходный размер 2500x1405
Исходный размер 2500x1405
Исходный размер 2500x1405


