
Описание проекта
Для анализа я выбрала любопытный датасет «Индекс счастья города — 2024», который был взят с платформы Kaggle. Этот набор данных интересен тем, что он позволяет исследовать взаимосвязь между различными городскими факторами и уровнем счастья жителей по всему миру. Счастье — это сложный и многогранный показатель, который зависит от множества факторов, и анализ этих данных может помочь понять, какие аспекты городской жизни наиболее важны. Это актуальная тема, так как урбанизация и качество жизни в городах становятся всё более важными вопросами для каждого из нас.
Данные включают разнообразные метрики, такие как уровень шума, плотность трафика, площадь зелёных зон, качество воздуха, стоимость жизни, качество здравоохранения и общий балл счастья, что позволяет исследовать комплексные взаимосвязи.

Для визуализации данных я выбрала следующие типы графиков:
— Столбчатая диаграмма Позволяет наглядно показать и выделить лидеров по уровню счастья между городами.
— Линейный график: Позволяет продемонстрировать влияние площади зелёных зон на уровень счастья. Линейный график хорошо подходит для отображения тенденций, зависимостей и анализа изменений показателей по времени.
— Точечный график и точечный график с линией тренда Позволяет показать зависимость уровня счастья от качества воздуха. Точечный график помогает выявить корреляцию между двумя переменными.
— Круговая диаграмма Позволяет визуализировать пропорции, таких как распределение городов по плотности трафика. Это позволяет быстро оценить, какой процент городов имеет низкий, средний, высокий или очень высокий уровень трафика.
Я выбрала эти виды графиков, чтобы наиболее наглядно визуализировать разницу между данными и все было понятно с первого взгляда.
Этапы работы
Первым шагом я загрузила данные из CSV-файла с помощью библиотеки pandas. После загрузки я провела предварительный анализ данных, чтобы понять их структуру и наличие пропущенных значений. Этот этап позволил мне убедиться, что данные загружены корректно и не содержат явных ошибок.
Так как датасет включал данные на английском языке, для удобства я частично обработала категориальные данные, переведя их на русский язык с помощью словаря. Применение можно увидеть дальше в конкретных графиках.
Для создания графиков я использовала сортировку данных. Использование можно увидеть в кодах для графиков ниже. Например, для построения графика топ-10 городов по уровню счастья я отсортировала данные по колонке Happiness_Score.
При стилизации графиков я вдохновлялась изображением, сгенерированным мной в ReCraft. На ней изображены элементы городской среды, такие как зелёные зоны, современные здания и чистый воздух, что символизирует ключевые факторы, влияющие на уровень счастья в городе. Изображение было стилизовано с использованием пастельных тонов и минималистичного дизайна, чтобы подчеркнуть важность экологии и качества жизни в городской среде, цвета были заданы мной. Также обложка проекта сгенерирована с помощью ReCraft.
Картинка-референс
В графикахя я использовала шрифт DejaVu Sans для всех текстовых элементов на графиках, чтобы обеспечить единообразие и читаемость. Также я добавила заголовки, подписи осей и значения на графиках, чтобы сделать их более информативными.
Для создания гармоничного стиля я использовала светлый фон (#FAF8EC) для всех графиков. Это помогает выделить данные и делает графики менее перегруженными. Обработка данных и стилизация графиков были выполнены с акцентом на ясность и понятность.
Итоговые графики
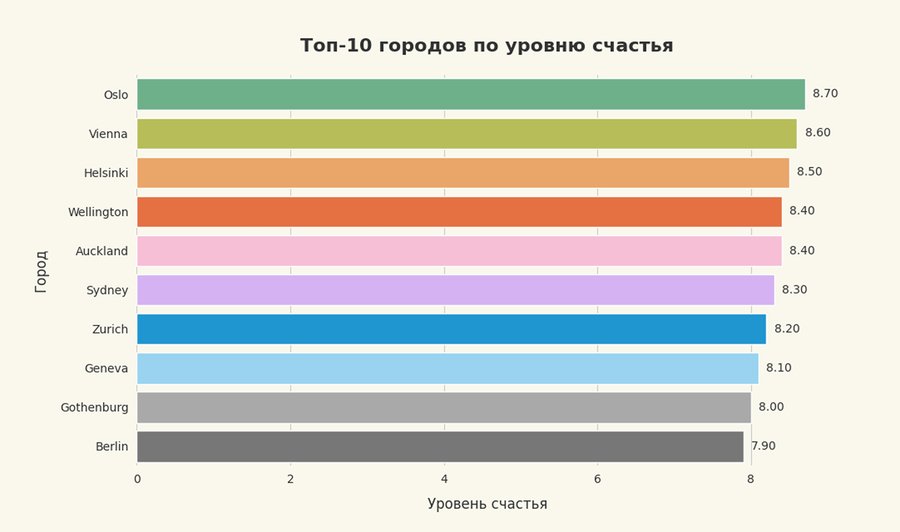
График 1: Топ-10 городов по уровню счастья
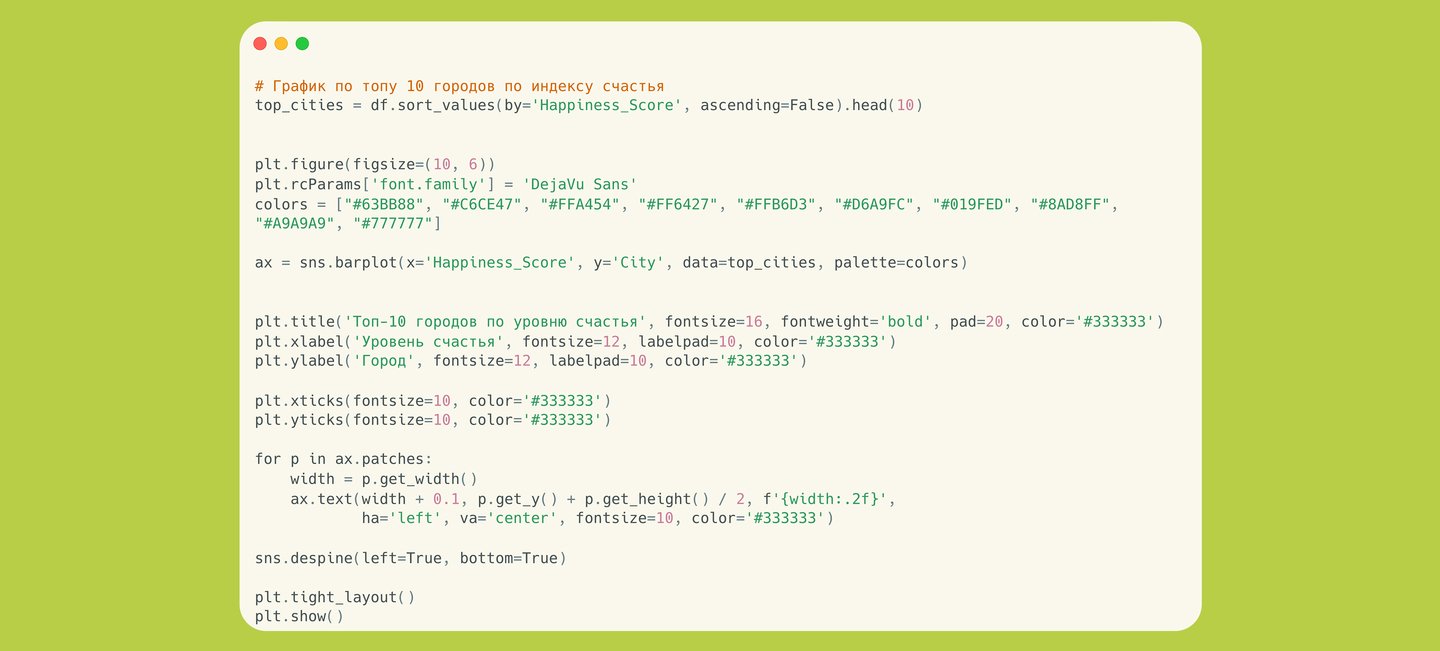
Столбчатая диаграмма, визуализирующая данные о влиянии зеленых зон на уровень счастья
На графике представлены данные о 10 городах с самым высоким уровнем счастья. Лидером рейтинга является Осло, за ним следуют Вена и Хельсинки. Остальные города, такие как Веллингтон, Окленд и Сидней, имеют схожие значения.
Лидирующие позиции занимают города преимущественно из Европы и Океании, что может быть связано с развитой инфраструктурой, социальной поддержкой и благоприятными условиями для жизни.
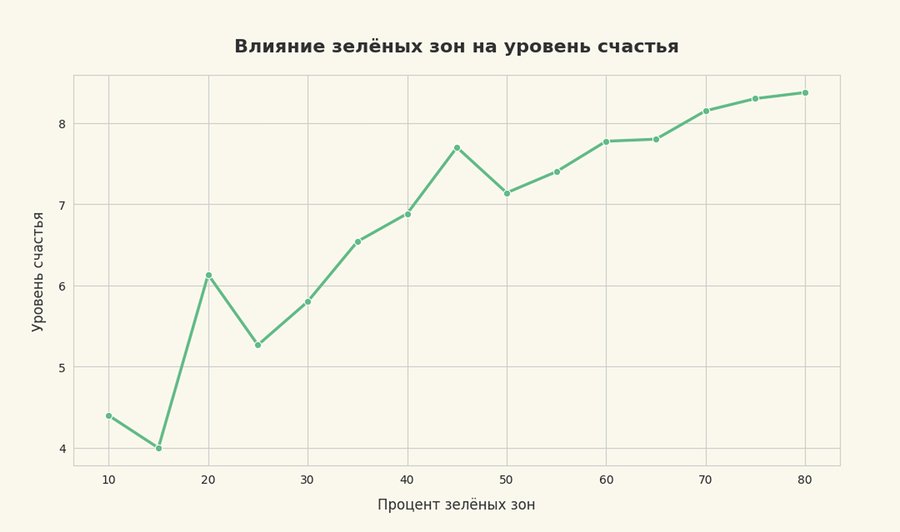
График 2: Влияние зелёных зон на уровень счастья
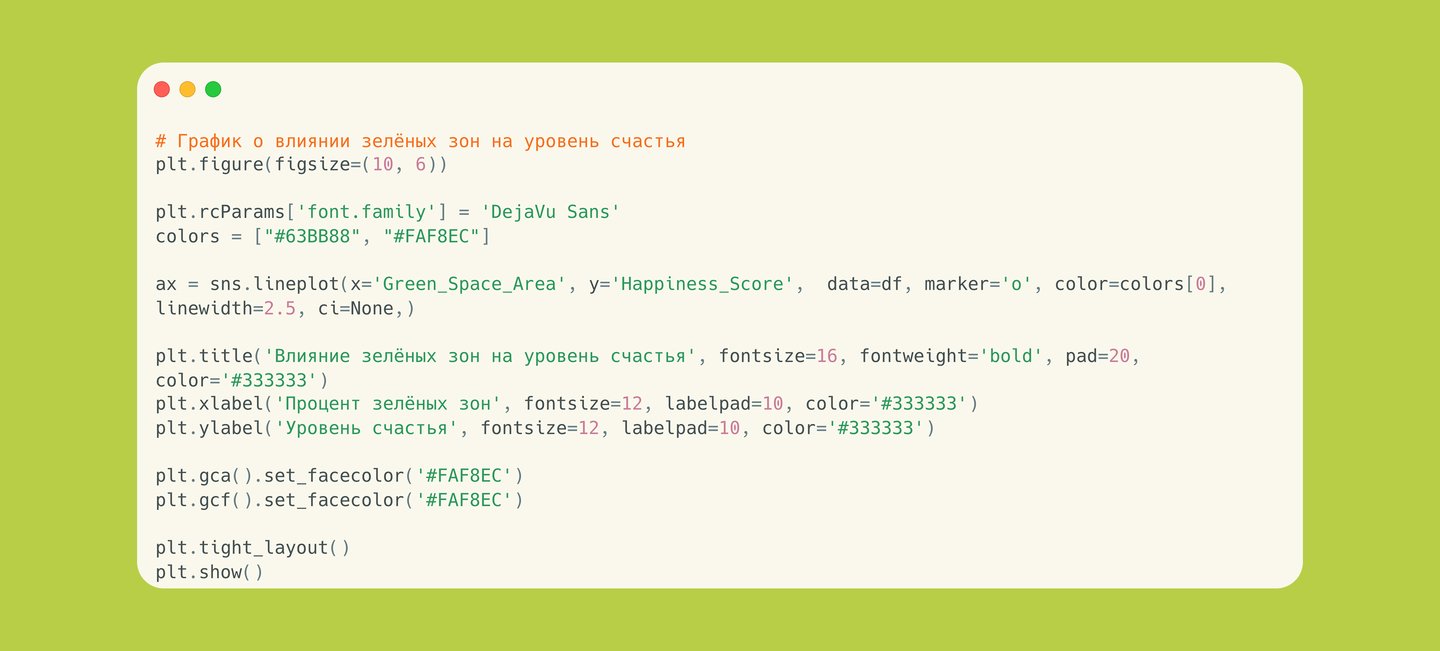
Линейный график и код к нему о влиянии зелёных зон на уровень счастья
График демонстрирует положительную корреляцию между процентом зелёных зон в городе и уровнем счастья. Становится понятно, чем больше зелёных насаждений, тем выше уровень счастья жителей.
График 3: Распредление городов по плотности трафика
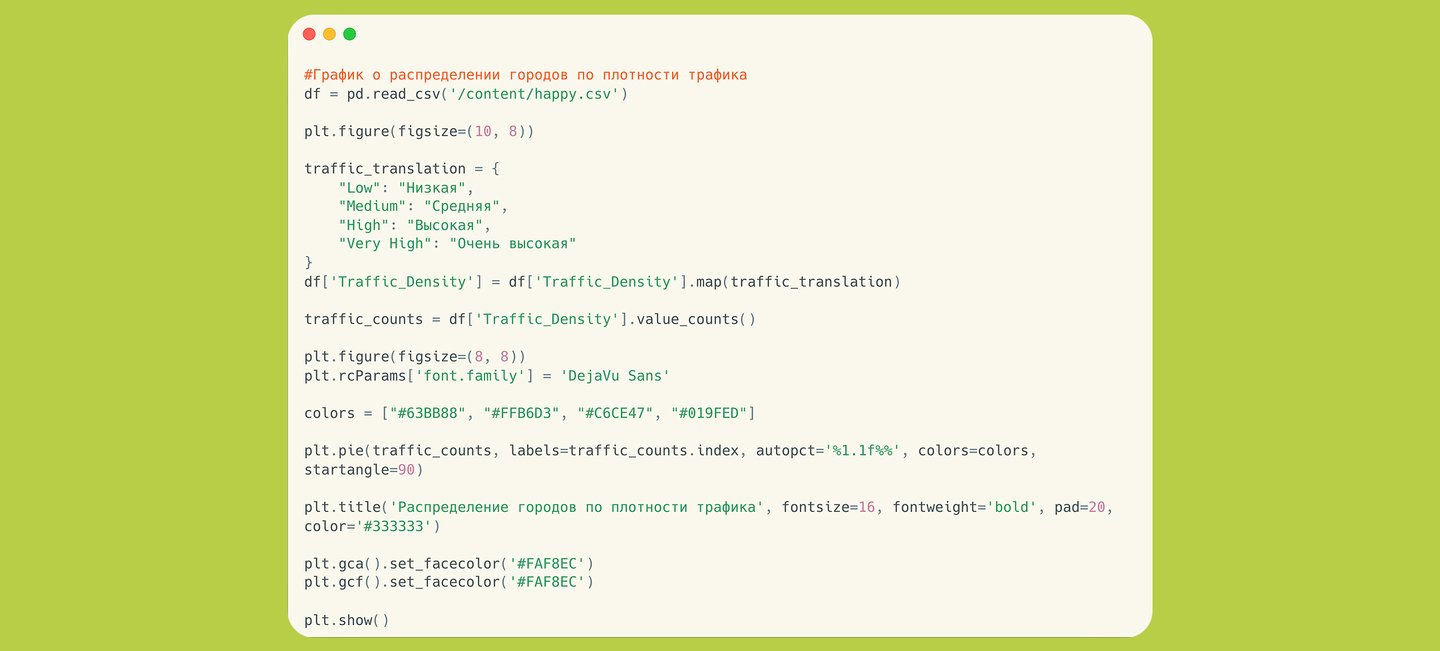
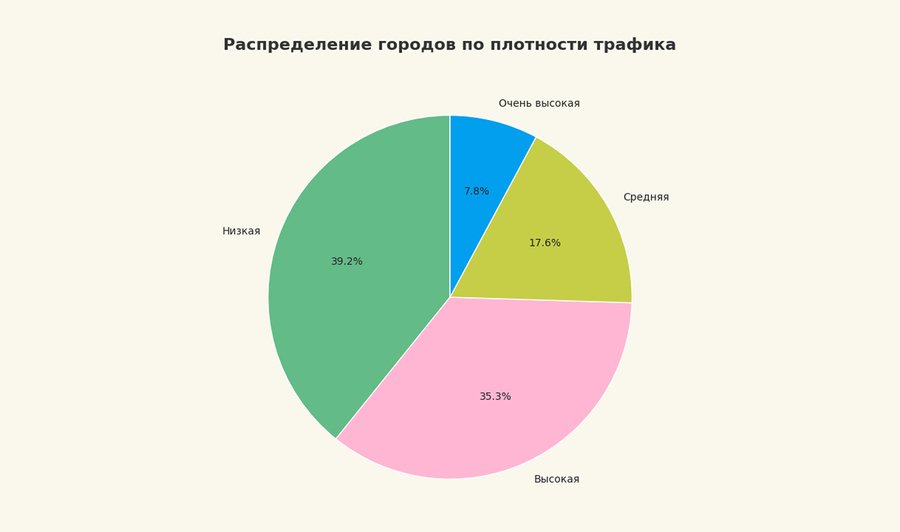
Круговая диаграмма, иллюстрирующая распределение городов по плотности трафика
На графике видно, что большинство городов имеют среднюю плотность трафика (35.3%). Очень высокая плотность трафика наблюдается в 17,6% городов, что может негативно влиять на уровень счастья из-за повышенного стресса и ухудшения мобильности.
График 4: Зависимость счастья от качества воздуха и трафика
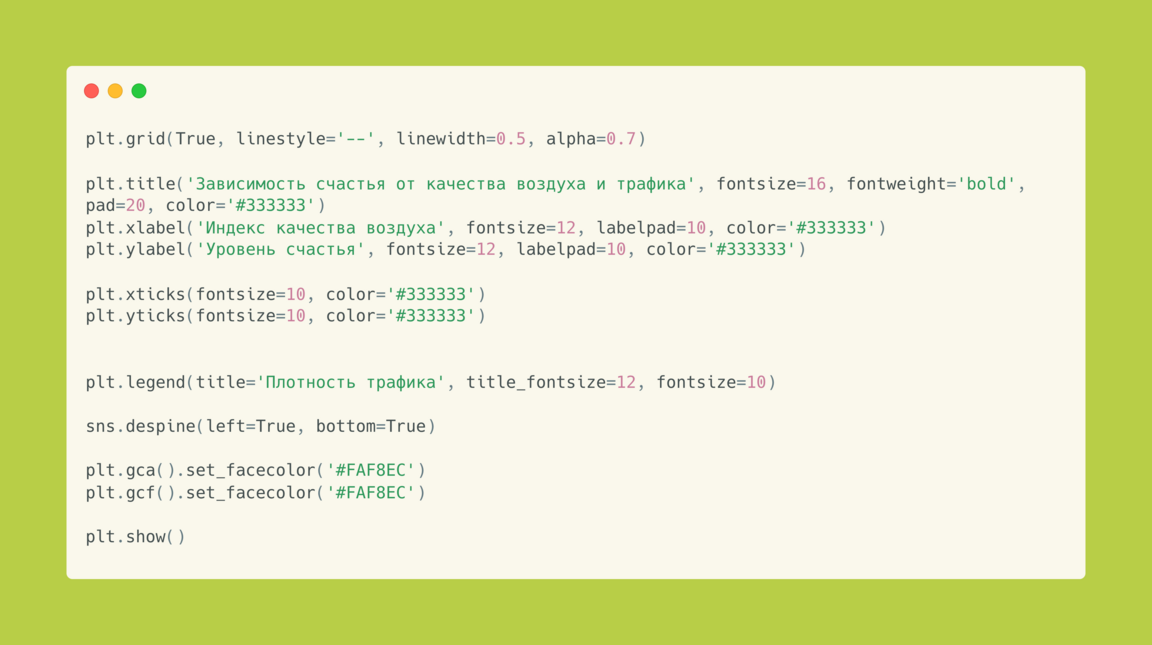
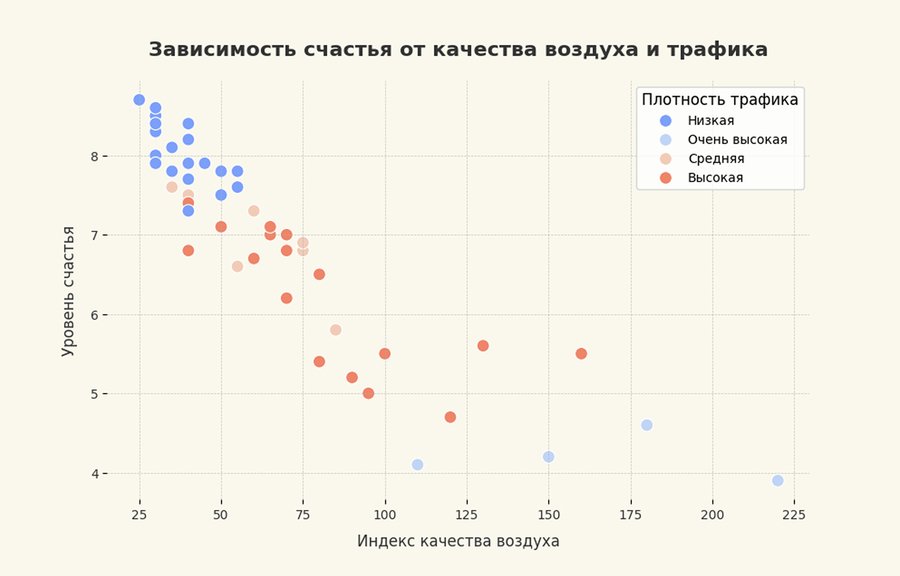
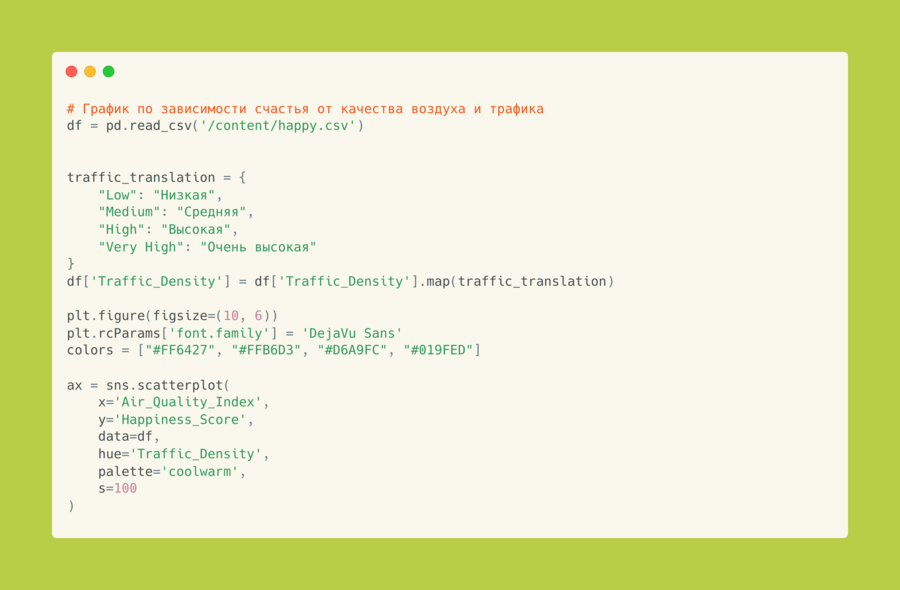
Точечный график, иллюстрирующий зависимость счастья от качества воздуха и трафика
Точечный график показывает зависимость уровня счастья от качества воздуха с учётом плотности трафика. Видна отрицательная корреляция: чем лучше качество воздуха, тем выше уровень счастья. Города с низкой плотностью трафика чаще имеют более высокий уровень счастья, даже при среднем качестве воздуха, что указывает на важность мобильности и снижения стресса. Города с очень высокой плотностью трафика, даже при хорошем качестве воздуха, имеют более низкий уровень счастья, что подчёркивает негативное влияние пробок. Становится ясно, что для повышения уровня счастья нужно улучшать качество воздуха и снижать плотность трафика, учитывая комплексное взаимодействие этих факторов.
График 5: Зависимость уровня счастья от стоимости жизни
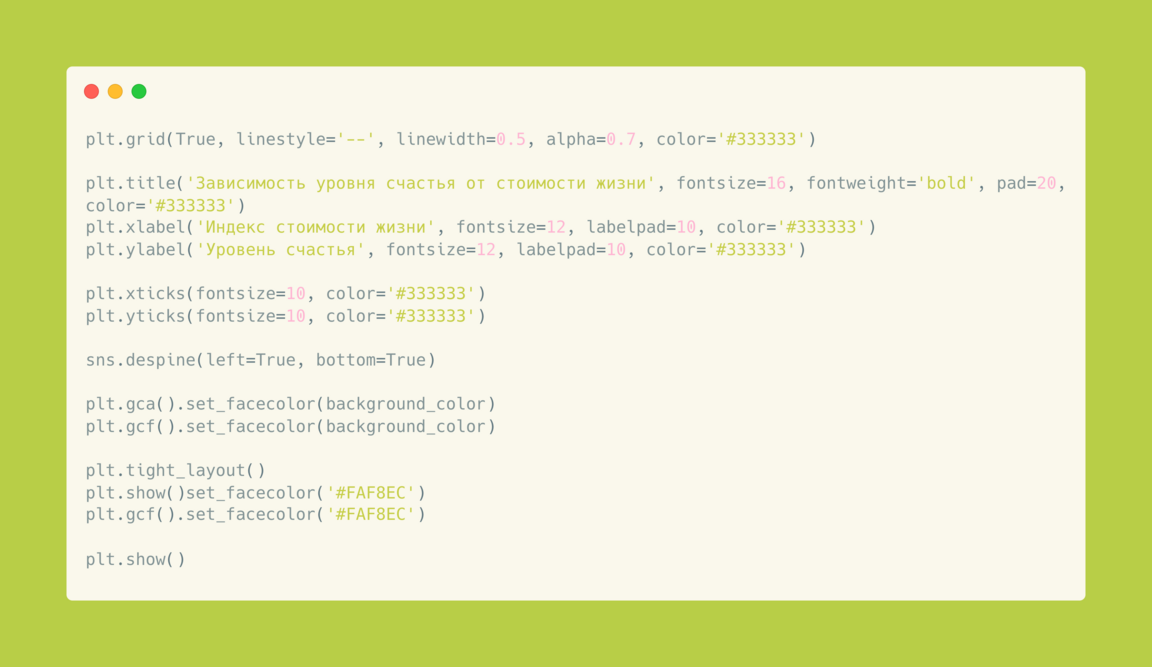
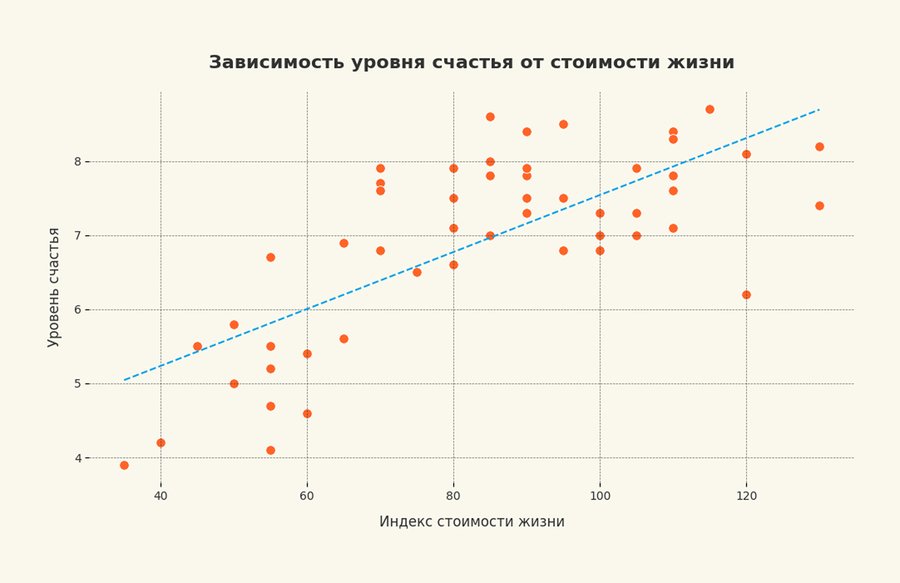
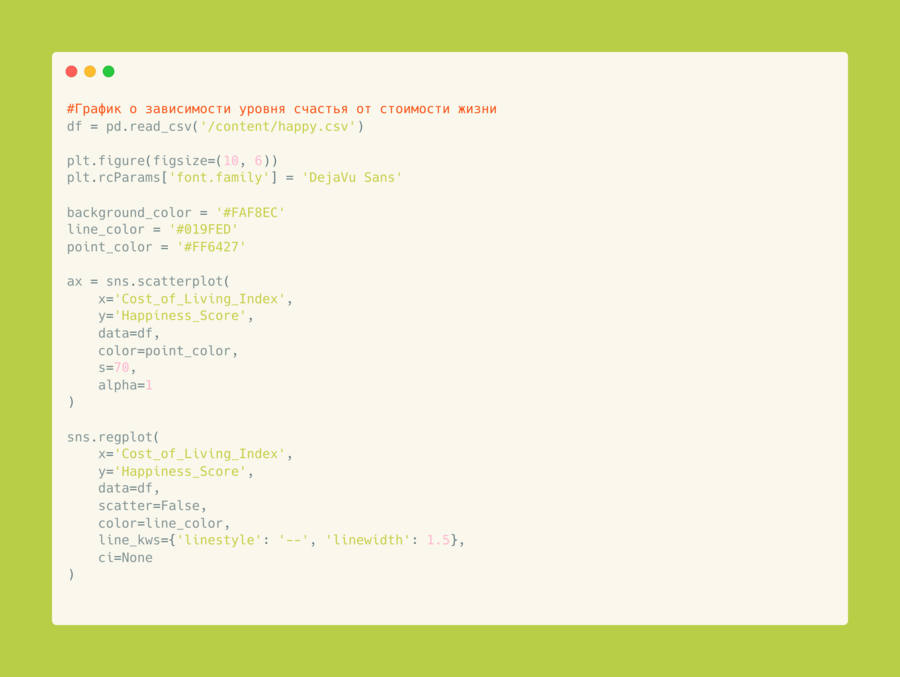
Точечный график с линией тренда и код к нему о зависимости уровня счастья от стоимости жизни
На представленном графике показана зависимость уровня счастья от индекса стоимости жизни. Линия тренда демонстрирует положительную корреляцию: с ростом стоимости жизни уровень счастья, как правило, увеличивается. Однако разброс данных вокруг линии тренда свидетельствует о том, что связь между этими переменными не является строгой. Это указывает на то, что высокая стоимость жизни может способствовать более высокому уровню счастья, но не является единственным определяющим фактором.
Выводы
Анализ графиков показывает, что уровень счастья в городах зависит от множества факторов, включая экологию, инфраструктуру и качество жизни. Улучшение этих аспектов может способствовать повышению уровня счастья населения. Комплексный подход способствует созданию более счастливого общества.
Описание применения генеративной модели


