Concept
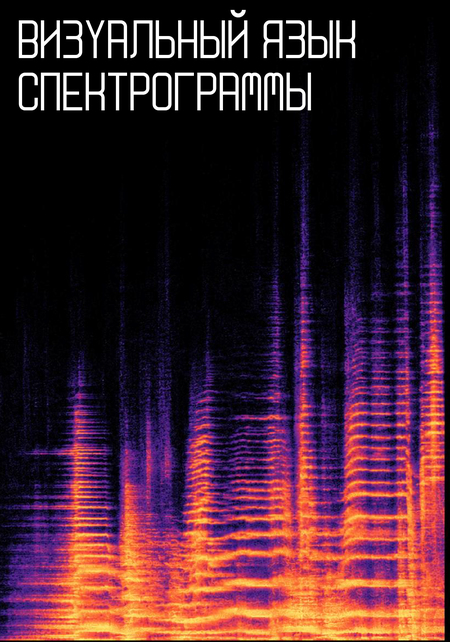
Sound is an invisible phenomenon that cannot be directly perceived by the human eye. However, with the advancement of scientific technology, it has become possible to translate acoustic processes into visual forms. One such method is the spectrogram—a graphical representation of sound that allows us to see the distribution of frequencies and the change in their intensity over time. A spectrogram translates sound into a visual form, revealing its internal structure through time, frequency, and intensity. Moreover, a spectrogram can be viewed not just as a scientific tool for sound analysis, but also as a unique visual language with its own patterns, forms, rhythms, and color characteristics. The spectrogram sits at the intersection of science, technology, and visual art. Originally created as a tool for investigating and analyzing sound signals, it has gradually become not only a means of obtaining objective information about sound but also a source of unusual visual imagery. Lines, spots, geometric structures, repeating rhythms, and color transitions form a distinct visual language. This research is dedicated to studying the spectrogram as a method of visually representing sound: from its history to the emergence and development of spectral analysis technologies, and finally to the features of its visual structure and its application in various fields of science, design, and art. The objective of the research is to trace how the perception of sound has changed throughout history, to examine the principles of constructing spectrograms, to understand the meaning of their primary visual elements, and to explore how the same sound can look different depending on the visualization and analysis settings. The concluding part of the research involves studying spectrograms composed from field recordings of the sound environment. This will serve as an experimental extension of the study and will demonstrate the visual diversity of real-world sounds. The aim of the research is to study the history of the emergence and development of spectrograms, to investigate the principles of their construction and primary visual characteristics, and to identify the unique qualities of the spectrogram as an independent method for visually representing sound information.
Research Objective
The core idea of this visual exploration is to demonstrate that a spectrogram is not merely a technical chart, but an entire system of visual language capable of transforming invisible acoustic processes into diverse graphical forms.
Navigation
- History of Spectrograms
- Spectrogram Structure
- Visual Language
- Spectrogram Diversity
- Spectrogram Applications
- Creating Spectrograms from Field Recordings
The History of Spectrograms
Long before the advent of spectrograms, scientists sought to understand the nature of sound and whether its physical manifestations could be observed. In 1787, for instance, German physicist Ernst Helmholtz demonstrated that sound is capable of creating visible patterns—he sprinkled sand onto metal plates and drew a bow across them. As the plates vibrated, the sand particles moved and accumulated along the lines where the oscillations were minimal. These patterns came to be known as «Helmholtz figures.» This experiment proved that sound vibrations can leave a visual trace.
Visualized Figures of Khladni
In the latter half of the 19th century, a significant turning point occurred in the history of sound studies: humans learned not only to hear sound but also to record, preserve, and reproduce it. Three inventions played a special role in this evolution: Édouard-Léon Scott de Martinville’s phonautograph, Charles Cros’s phonautograph, and Thomas Edison’s phonograph. In 1857, the French inventor Édouard-Léon Scott de Martinville created the phonautograph—a device capable of recording sound vibrations onto a smoked surface. The sound caused a diaphragm to vibrate, and a needle attached to it traced a graphical line on the surface. Martinville’s phonautograph differs from modern devices because it was not intended for sound reproduction; its primary function was to visually capture sound vibrations.
The phonograph was the first known device capable of preserving sound vibrations as a graphic image. It proved that sound, despite its invisibility and transient nature, is capable of leaving a material trace. This is why the phonograph can be considered one of the most important precursors to the spectrogram. However, it is important not to confuse the two: the phonograph recorded the shape of the vibrations, not the frequency distribution over time.
Image of a background autograph created by de Martenville
The inventor Eduard-Leon Scott de Martenville studied books and scientific texts. While reading a book on physiology, he became interested in the description of the human ear. He wondered: if the human eye could be used to fix an image, could an artificial ear be created that would record sounds? He was intrigued by the idea of transforming speech into a form of writing—making uttered words leave a material trace. He named this idea phonautography—the automatic writing of sound. The device imitated the working principle of the human ear: sound waves entered an acoustic funnel and acted upon a thin membrane resembling the eardrum. A fine needle was attached to the membrane—driven by the vibrations, the needle moved and left a mark on the soot-covered surface. As the surface moved, an uninterrupted graphic recording of the sound was produced.
Visualization of the Martenville fan autograph records
The automatic signature appeared as white, wavy lines etched onto a dark, smoky background.
De Martenville experimented with voice, singing, and musical sounds. In 1860, he recorded several fragments, including the French song «Au Clair de la Lune.» However, the device had a fundamental limitation: it could record sound but not reproduce it. He considered his recordings primarily as material for visual and scientific study. The phonautograph became the first known device capable of preserving sound vibrations as a graphic image. He demonstrated that sound, despite its invisibility and ephemeral nature, is capable of leaving a material trace. For this reason, the phonautograph can be considered one of the most important precursors to the spectrogram.
Following the phonograph, two other inventions emerged, which became the progenitors of modern spectrograms.
Since phonographs already existed in the latter half of the 19th century—devices capable of recording sound onto a surface—the issue of preserving that recorded sound remained open. At that time, the scientist and inventor Charles Cros pondered the creation of a device that could solve this problem. He proposed a method by which a graphic representation of sound vibrations could be converted back into sound. Cros developed the design for this device, which he named the paléophone. His idea was as follows: sound vibrations were first recorded onto a surface, and the resulting drawing was transformed into a relief track. A stylus moved along this track, replicating the recorded vibrations, and the stylus transmitted these movements to a diaphragm. The diaphragm, in turn, generated sound vibrations in the air once more. Thus, Cros sought to create a system capable of reconstructing sound from its material trace. However, Cros never built the paléophone himself. He developed the theoretical principle of sound reproduction but did not create a functional apparatus to demonstrate his idea in practice. Cros is considered one of the first people to propose a technically sound method for reproducing recorded sound.
The paleophone marked a new stage in humanity’s relationship with sound. While the phonograph allowed for the preservation of its visual trace, Cro’s idea proposed the possibility of returning that trace to its original sound. It was this concept of reversing the transformation of a recording into sound that became a crucial step toward creating sound recording and playback devices.
In 1877, Thomas Edison also conceived of the phonograph. While experimenting with devices capable of recording transmitted messages, he posed a question: if a machine could capture electrical signals, could it similarly preserve the vibrations of the human voice? Edison was interested not only in recording but also in the ability to reproduce the saved sound multiple times.
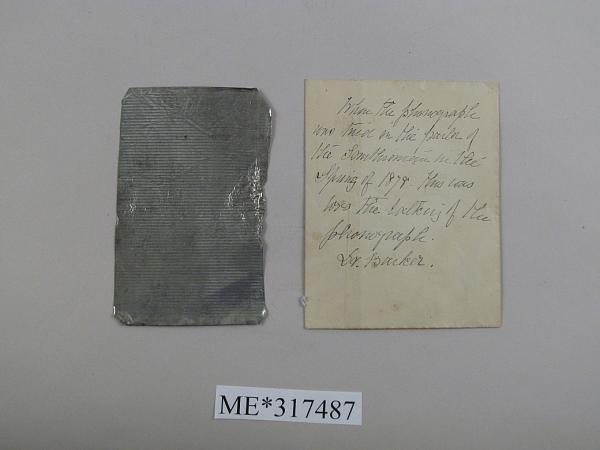
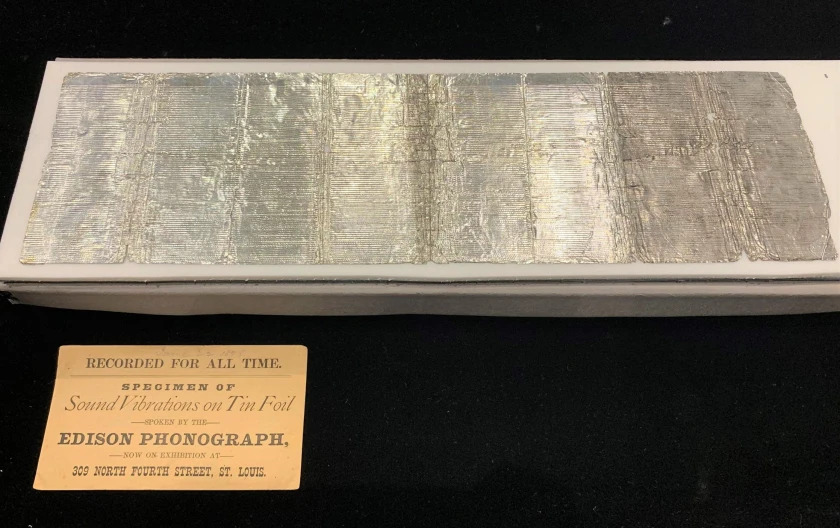
Visualization of sounds recorded on an Edison phonograph